
Solutions · HSE
Incident reporting software: health, safety and environment on one system
Incident reporting software and HSE software for companies in Canada, the UK, the Gulf and Pakistan that keeps hazard observations, incident investigation and equipment inspections in one module, sharing the same locations, the same branches and the same evidence trail.
One module, three parts
Incident reporting software with observations, incidents and inspections together
Safety data only becomes useful when the pieces sit together. HSE software with an observation, incident and inspection record side by side is what makes that possible. Observations, incidents and inspections share the same location structure, the same branches, the same evidence handling and the same reporting, so the pattern is visible without anyone having to go looking for it.
Safety observations
Report a hazard or near miss in under a minute, from a phone, with a photo.
Incident investigation
Record and investigate through a real staged chain, with your injury rates calculated from the records.
QR inspection checklists
Checklist driven inspections opened by scanning the QR tag on the equipment itself.
The problem today
Why safety records never add up
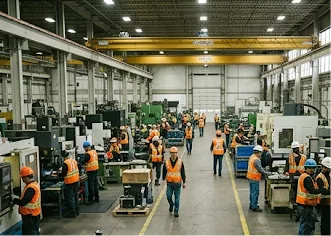
Without incident reporting software, a hazard reported in March, an incident in the same area in June and a run of failed inspections on the same equipment are one story, but in most companies they live in three separate files owned by three different people.
Observation cards go in a box on a wall and get emptied on a Friday, if somebody remembers. Incidents get written up a day or two later, when the detail has already softened. Inspections get ticked on paper and typed up a fortnight afterwards from handwriting nobody can read.
The company genuinely does the work, but it cannot connect any of it, so every event is treated as the first time it has ever happened. Then the auditor arrives and asks for the safety records for the year, and the safety manager spends two days assembling from three sources something that should have taken a click.
Section one · Observations
Report a hazard before it becomes an incident
Observation reporting is the earliest warning a company gets. A loose handrail, a blocked exit, a spill nobody cleaned, a near miss that made someone’s stomach drop. Act on those and the serious incidents thin out. Make reporting slow or awkward and people stop bothering.
This part of the module is built to be fast at the one moment that matters, when someone is standing in front of the problem holding a phone. They take a photo, pick the location, describe what they saw, and it is in the system with a reference number before they have walked away.
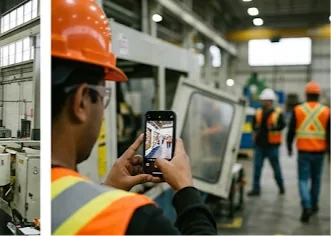
Safety reporting in the phone browser
No app to install, which matters when a good share of the people on your site are contractors on their own devices.
Speed is the safety feature
Every extra field and every extra tap costs you reports, and the reports you lose are the ones taken in a hurry by someone who nearly did not bother.
Precise observation location
Area, then location, then sub location. Three observations in the same sub location in a month is a story; three described as “by the tanks” is a shrug.
What it holds
Every observation carries what was seen in the reporter’s own words, photographs, the branch, and a precise location as area, then location, then sub location. That precision is what makes the data worth having.
How it works
How a safety hazard is reported and closed
Four stages, deliberately few. Reporting and closing both have to be fast enough that people keep doing them.
Observation workflow
Section two · Incidents
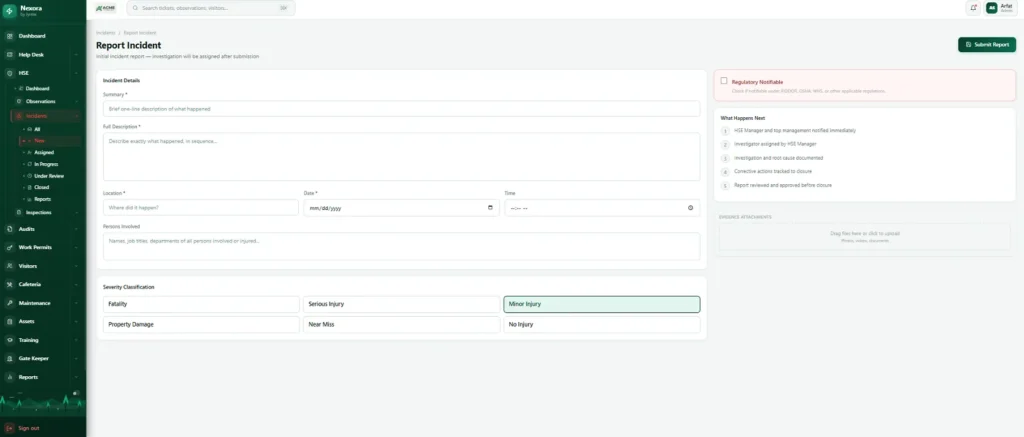
An incident investigation, not a status box
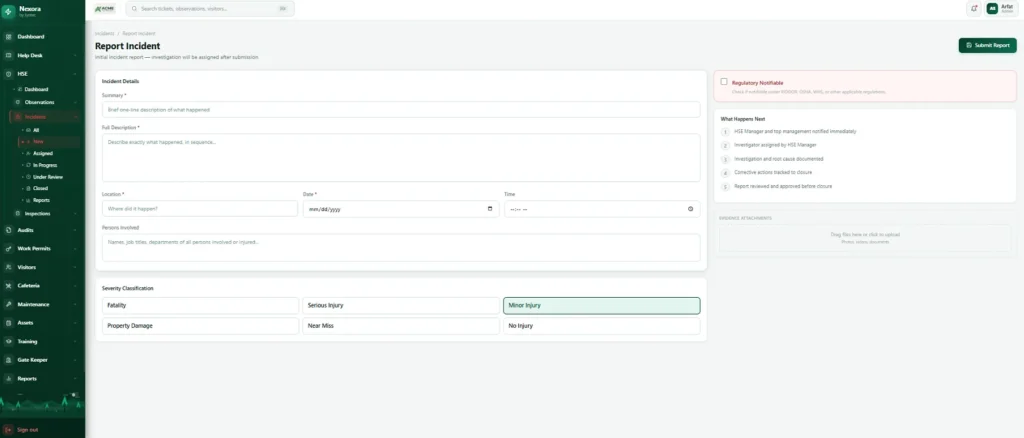
Most incident reporting software has only two states, open and closed. That is not an investigation, it is a filing cabinet with a lid. Nexora holds the whole chain instead. An incident is reported, an investigator is assigned, the investigation runs, root cause analysis happens as its own recorded stage, the findings are reviewed, and only then does it close.
Each stage is recorded with its timing, so a supervisor can see where every open investigation has got to and an auditor can see that the process was genuinely followed rather than summarised afterwards.
Incident severity that stays consistent
Six levels, applied the same way every time: fatality, serious injury, minor injury, property damage, near miss, no injury. Near misses and property damage stay in the same system as the injuries, because those are the cheap lessons.
The safety number, calculated properly
The lost time injury frequency rate is calculated from the incident records and from man hours entered per branch per month, so the rate is derived rather than declared by somebody’s spreadsheet.
One honest HSE limitation
If a month of man hours has not been entered for a branch, the rate for that branch is calculated on incomplete hours and will quietly flatter you. Make man hours entry part of your monthly routine.
Investigation trail
The investigation chain and its conclusion are recorded on the incident, with a timestamp at every stage. A full corrective action lifecycle with named owners, due dates and effectiveness verification is on our roadmap and is not in the product today.
Live dashboard
An HSE dashboard built from your own records
Incidents, observations and inspection results in one live view.
HSE dashboard
How it works
How an incident is investigated
Six stages, every one timestamped. This is the longest workflow in the platform, and the length is the point.
Incident workflow
Section three · Inspections
Scan the tag, run the inspection checklist
Inspections are where HSE software either becomes real or becomes paperwork. The task is simple: go to the thing, check the list, record what you found. What makes it hard is finding the right checklist, knowing which piece of equipment you are standing in front of, and typing up clipboard results later, badly.
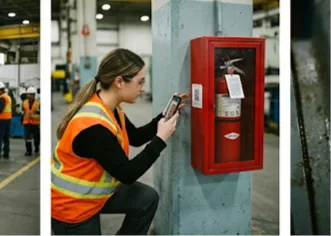
Here the inspector scans the QR tag on the equipment, the correct checklist opens against that exact asset, they work through it on the phone, and it is scored and filed before they walk away.
Identification
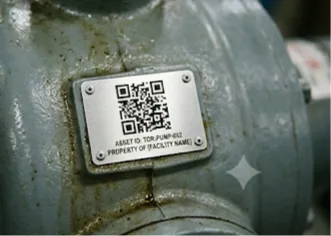
Every asset in Nexora carries its own QR code. The inspector opens the scanner inside Nexora, points the phone at the tag, and the system knows exactly which unit it is, then opens the checklist belonging to that asset’s category.
On paper, an inspector writes “extinguisher, workshop, checked”, but there are eleven in the workshop. Here every result is bound to a specific unit, which over time gives you a per unit history: this extinguisher has failed twice in eighteen months, that pump never has. Now equipment spending is an evidence based decision.
Scanning happens in the phone browser using the camera, with no separate scanner app.
Scoring and evidence
Compliance is calculated as the inspection happens, so when the inspector submits, the result is already a percentage recorded against the asset and visible on the dashboard. Nobody counts ticks and nobody types anything up.
Any item can carry a photograph, and in practice the failed items are the ones that get photographed. A written note saying “guard damaged” is an opinion. A photo of the damaged guard is a fact, and it stays on the record permanently.
Inspection templates that stay consistent
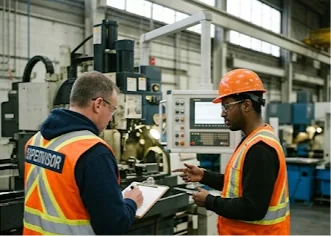
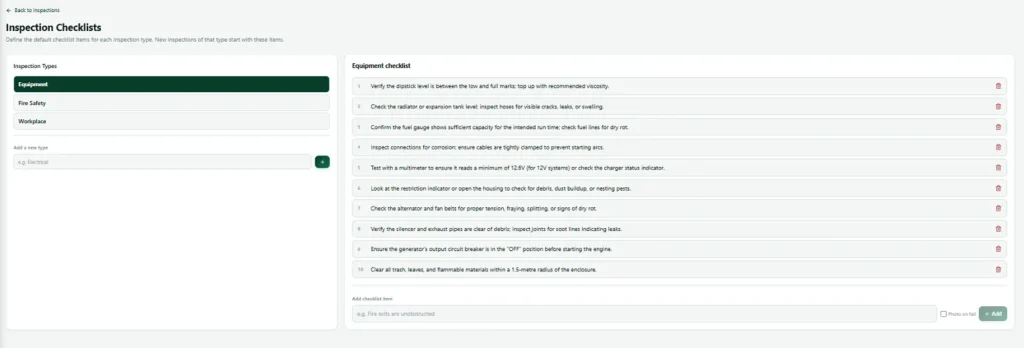
Checklist templates are set per inspection type by your own administrators, so everyone inspecting the same kind of thing asks the same questions in the same order.
Inspection checklists inherited by category
Templates attach to asset categories, so new equipment inherits the right checklist. Add twenty new extinguishers and all twenty are ready to inspect properly the same day.
Safety evidence where it counts
Photographs attach to any checklist item and stay on the record permanently.
How it works
How an inspection runs
The whole thing happens standing in front of the equipment, on a phone, in one visit.
Inspection workflow
Shared across all three
The HSE equipment register underneath
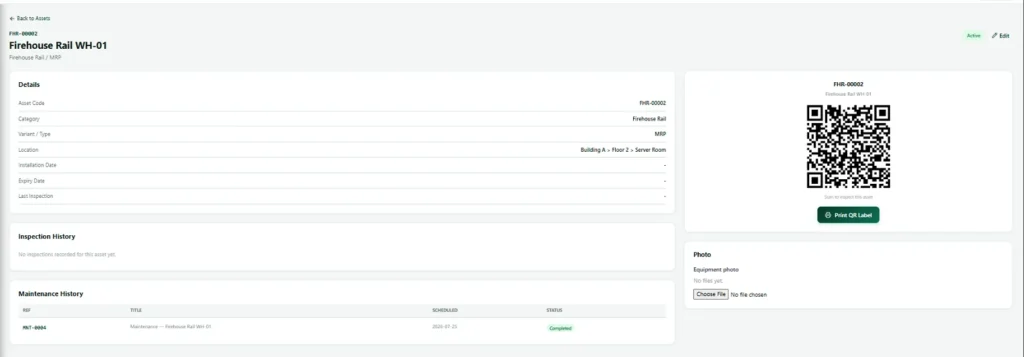
Inspections work the way they do because of a shared equipment register sitting under the module. Every asset has a code, a category and its own QR code, and the same record is used by the maintenance side of the platform.
Deleting an asset is a soft delete, so history is never destroyed. That shared register is why an asset page can show its inspection history and its maintenance history in one view, which is the view that answers whether to repair something for the fourth time or replace it.
Shared across all three
One location structure for every HSE record
Area, then location, then sub location, with a branch on top. Set up once by your administrators and used identically by observations, incidents and inspections. Three records describing the same place in three different ways will never line up.
HSE branch
Sits on top of the structure and is used by observations, incidents and inspections alike.
HSE area
The first level of the structure, set up once by your administrators.
HSE location
The second level, inside an area.
HSE sub location
The precise spot, which is what makes the pattern visible.
What gets recorded
What incident reporting software records for every event
Reference numbers on everything. Photographs and documents attached to records rather than sitting in folders. Who did what and when. Full history retained for as long as you need it.
| Record | What is captured |
|---|---|
| Observations | What was seen in the reporter’s own words, photographs, the branch, and a precise location as area, then location, then sub location, under a reference number. |
| Incidents | Severity (one of six levels), each investigation stage with its timing, root cause analysis as its own stage, the findings review and the conclusion. Man hours are entered per branch per month. |
| Inspections | The specific asset identified by its QR tag, the checklist template for its category, the compliance percentage and any photographs on failed items. |
| Across all three | Reference numbers, attached photographs and documents, who did what and when, and every status change with its timing. |
What the manager sees
What the manager sees in the HSE dashboard
And when an auditor arrives, a complete searchable set of safety records instead of two days of assembly.
| Area | What the manager sees |
|---|---|
| Observations | Observation volume and where it comes from. |
| Investigations | Open investigations and the stage each has reached. |
| Inspections | Inspection compliance and which assets keep failing. |
| Incidents | Incidents by severity, branch and location. |
| Injury rate | The lost time injury rate calculated from your records. |
| Audit readiness | A complete searchable set of safety records. |
The lost time injury rate is only complete when man hours have been entered for the month.
Works with
Incident reporting software that works with the rest of Nexora
Safety audits
Findings close only with a root cause and a corrective action written in.
Maintenance after inspection
Preventive schedules that generate work orders automatically, linked to the same asset register.
Work permits for safety
Area aware approval, and permits that expire on their own.
Safety training & LMS
Courses, exams, learning paths and certificates with public verification.
QHSE
HSE software as a QHSE management system
Many companies run quality, health, safety and environment together as QHSE, with one QHSE manager responsible for all four. HSE software in Nexora fits that model: observations, incidents and inspections sit next to audits, permits to work, training and maintenance, all sharing the same people, locations and assets. Quality findings and safety findings end up in one place instead of two.
If you work towards a recognised standard such as ISO 45001 for occupational health and safety, HSE software that records evidence as the work happens makes certification audits far calmer. The records an auditor asks for already exist, with timestamps and photographs, rather than being rebuilt from paper the week before.
We work with sites in Canada, the UK, the UAE, Saudi Arabia, Qatar and Pakistan, from factories and construction projects to hospitals and campuses. The incident reporting software is the same everywhere; what changes is the vocabulary, the regulator and the mix of modules each site switches on.
What a QHSE setup in Nexora covers:
- Hazard observations and near misses
- Incident investigation with root cause
- QR based equipment inspection
- Safety audits and permits to work
- Training records that prove competence
Related: HSE records link to audits, work permits, maintenance and training, all on one asset register.
FAQ
Incident reporting software FAQs
Are observation, incident and inspection records separate products?
No. They are one HSE software module, licensed together, sharing locations, branches, evidence handling and reporting. That sharing is the reason patterns show up.
Do people need an app to use the incident reporting software?
No. Everything runs in the phone browser, including QR scanning, which matters when contractors are using their own devices.
Can someone report a safety hazard anonymously?
Not today. Reports are attributed to the person who made them. Anonymous reporting is on our roadmap.
How is the incident rate (LTIFR) calculated?
From the incident records and the man hours entered per branch per month. Both live in the system. Man hours need entering each month for the rate to be complete.
Can we control who sees HSE records?
Yes. Access is per user per module on top of roles, so incident records in particular can be limited to the people who should have them.
What should incident reporting software include?
Good incident reporting software lets anyone report from a phone in under a minute, routes the report to the right person, tracks the investigation and corrective actions, and shows trends across sites. Nexora adds observations and inspections, so the incident reporting software sits inside a full HSE record.
Can incident reporting software capture near misses?
Yes. Near misses are logged the same way as incidents, with photos and location, so you can act before someone is hurt. Most of the value of incident reporting software comes from the near misses people would never write up on paper.
See the incident reporting software working together
We will run a hazard report, an investigation and a scan to inspect on your own locations and equipment, the way a QHSE team works every day.